185 lines
7.6 KiB
Markdown
185 lines
7.6 KiB
Markdown
# Monitoring multiple Linux hosts with Grafana Agent Role
|
|
|
|
Monitoring with Grafana Agents across multiple Linux hosts can be difficult.
|
|
To make it easier, you can use the Grafana Agent role with the Grafana Ansible collection.
|
|
This guide shows how to use the `grafana_agent` Ansible role to deploy and manage Grafana Agents across multiple Linux hosts so you can monitor them in Grafana.
|
|
|
|
## Before you begin
|
|
|
|
Before you begin, you should have:
|
|
|
|
- Linux hosts
|
|
- SSH access to the Linux hosts
|
|
- Account permissions sufficient to install and use Grafana Agent on the Linux hosts
|
|
|
|
## Install the Grafana Ansible collection
|
|
|
|
The [Grafana Agent role](https://github.com/grafana/grafana-ansible-collection/tree/main/roles/grafana_agent) is available in the Grafana Ansible collection as of the 1.1.0 release.
|
|
|
|
To install the Grafana Ansible collection, run this command:
|
|
|
|
```
|
|
ansible-galaxy collection install grafana.grafana:2.0.0
|
|
```
|
|
|
|
## Create an Ansible inventory file
|
|
|
|
Next, you will set up your hosts and create an inventory file.
|
|
|
|
1. Create your hosts and add public SSH keys to them.
|
|
|
|
This example uses eight Linux hosts: two Ubuntu hosts, two CentOS hosts, two Fedora hosts, and two Debian hosts.
|
|
|
|
1. Create an Ansible inventory file.
|
|
|
|
The Ansible inventory, which resides in a file named `inventory`, looks similar to this:
|
|
|
|
```
|
|
146.190.208.216 # hostname = ubuntu-01
|
|
146.190.208.190 # hostname = ubuntu-02
|
|
137.184.155.128 # hostname = centos-01
|
|
146.190.216.129 # hostname = centos-02
|
|
198.199.82.174 # hostname = debian-01
|
|
198.199.77.93 # hostname = debian-02
|
|
143.198.182.156 # hostname = fedora-01
|
|
143.244.174.246 # hostname = fedora-02
|
|
```
|
|
|
|
> **Note**: If you are copying the above file, remove the comments (#).
|
|
|
|
1. Create an `ansible.cfg` file within the same directory as `inventory`, with the following values:
|
|
```
|
|
[defaults]
|
|
inventory = inventory # Path to the inventory file
|
|
private_key_file = ~/.ssh/id_rsa # Path to my private SSH Key
|
|
remote_user=root
|
|
```
|
|
|
|
## Use the Grafana Agent Ansible role
|
|
|
|
Next you will create an Ansible playbook that calls the `grafana_agent` role from the `grafana.grafana` Ansible collection.
|
|
|
|
To use the Grafana Agent Ansible role:
|
|
|
|
1. Create a file named `deploy-agent.yml` in the same directory as `ansible.cfg` and `inventory` and add the configuration below.
|
|
|
|
```yaml
|
|
- name: Install Grafana Agent
|
|
hosts: all
|
|
become: true
|
|
|
|
vars:
|
|
grafana_cloud_api_key: <Your Grafana.com API Key> # Example - eyJrIjoiYjI3NjI5MGQxZTcyOTIxYTc0MDgzMGVhNDhlODNhYzA5OTk2Y2U5YiIsIm4iOiJhbnNpYmxldGVzdCIsImlkIjo2NTI5
|
|
metrics_username: <prometheus-username> # Example - 825019
|
|
logs_username: <loki-username> # Example - 411478
|
|
prometheus_url: <prometheus-push-url> # Example - https://prometheus-us-central1.grafana.net/api/prom/push
|
|
loki_url: <loki-push-url> # Example - https://logs-prod-017.grafana.net/loki/api/v1/push
|
|
tasks:
|
|
- name: Install Grafana Agent
|
|
ansible.builtin.include_role:
|
|
name: grafana.grafana.grafana_agent
|
|
vars:
|
|
grafana_agent_metrics_config:
|
|
configs:
|
|
- name: integrations
|
|
remote_write:
|
|
- basic_auth:
|
|
password: "{{ grafana_cloud_api_key }}"
|
|
username: "{{ metrics_username }}"
|
|
url: "{{ prometheus_url }}"
|
|
|
|
global:
|
|
scrape_interval: 60s
|
|
wal_directory: /tmp/grafana-agent-wal
|
|
|
|
grafana_agent_logs_config:
|
|
configs:
|
|
- name: default
|
|
clients:
|
|
- basic_auth:
|
|
password: "{{ grafana_cloud_api_key }}"
|
|
username: "{{ logs_username }}"
|
|
url: "{{ loki_url }}"
|
|
positions:
|
|
filename: /tmp/positions.yaml
|
|
target_config:
|
|
sync_period: 10s
|
|
scrape_configs:
|
|
- job_name: varlogs
|
|
static_configs:
|
|
- targets: [localhost]
|
|
labels:
|
|
instance: ${HOSTNAME:-default}
|
|
job: varlogs
|
|
__path__: /var/log/*log
|
|
grafana_agent_integrations_config:
|
|
node_exporter:
|
|
enabled: true
|
|
instance: ${HOSTNAME:-default}
|
|
prometheus_remote_write:
|
|
- basic_auth:
|
|
password: "{{ grafana_cloud_api_key }}"
|
|
username: "{{ metrics_username }}"
|
|
url: "{{ prometheus_url }}"
|
|
```
|
|
|
|
The playbook calls the `grafana_agent` role from the `grafana.grafana` Ansible collection.
|
|
The Agent configuration in this playbook send metrics and logs from the linux hosts to your prometheus and Loki data sources.
|
|
|
|
Refer to the [Grafana Ansible documentation](https://github.com/grafana/grafana-ansible-collection/tree/main/roles/grafana_agent#role-variables) to understand the other variables you can pass to the `grafana_agent` role.
|
|
|
|
When deploying the Agent across multiple instances for monitoring them, It is essential that the Agent is able to auto-detect the hostname for ease in monitoring.
|
|
Notice that the label `instance` has been set to the value `${HOSTNAME:-default}`, which is substituted by the value of the HOSTNAME environment variable in the Linux host.
|
|
To read more about the variable substitution, refer to the Grafana Agent [node_exporter_config](https://grafana.com/docs/agent/latest/configuration/integrations/node-exporter-config/) documentation.
|
|
|
|
1. To run the playbook, run this command:
|
|
|
|
```
|
|
ansible-playbook deploy-agent.yml
|
|
```
|
|
|
|
> **Note:** You can place the `deploy-agent.yml`, `ansible.cfg` and `inventory` files in different directories based on your needs.
|
|
|
|
## Check that logs and metrics are being ingested into Prometheus and Loki
|
|
|
|
Logs and metrics will soon be available in Grafana if your Promtheus and Loki datasources are added.
|
|
To test this, use the Explore feature.
|
|
Click the Explore icon (compass icon) in the vertical navigation bar.
|
|
|
|
### Check logs
|
|
|
|
To check logs:
|
|
|
|
1. Use the dropdown menu at the top of the page to select your Loki logs data source.
|
|
|
|
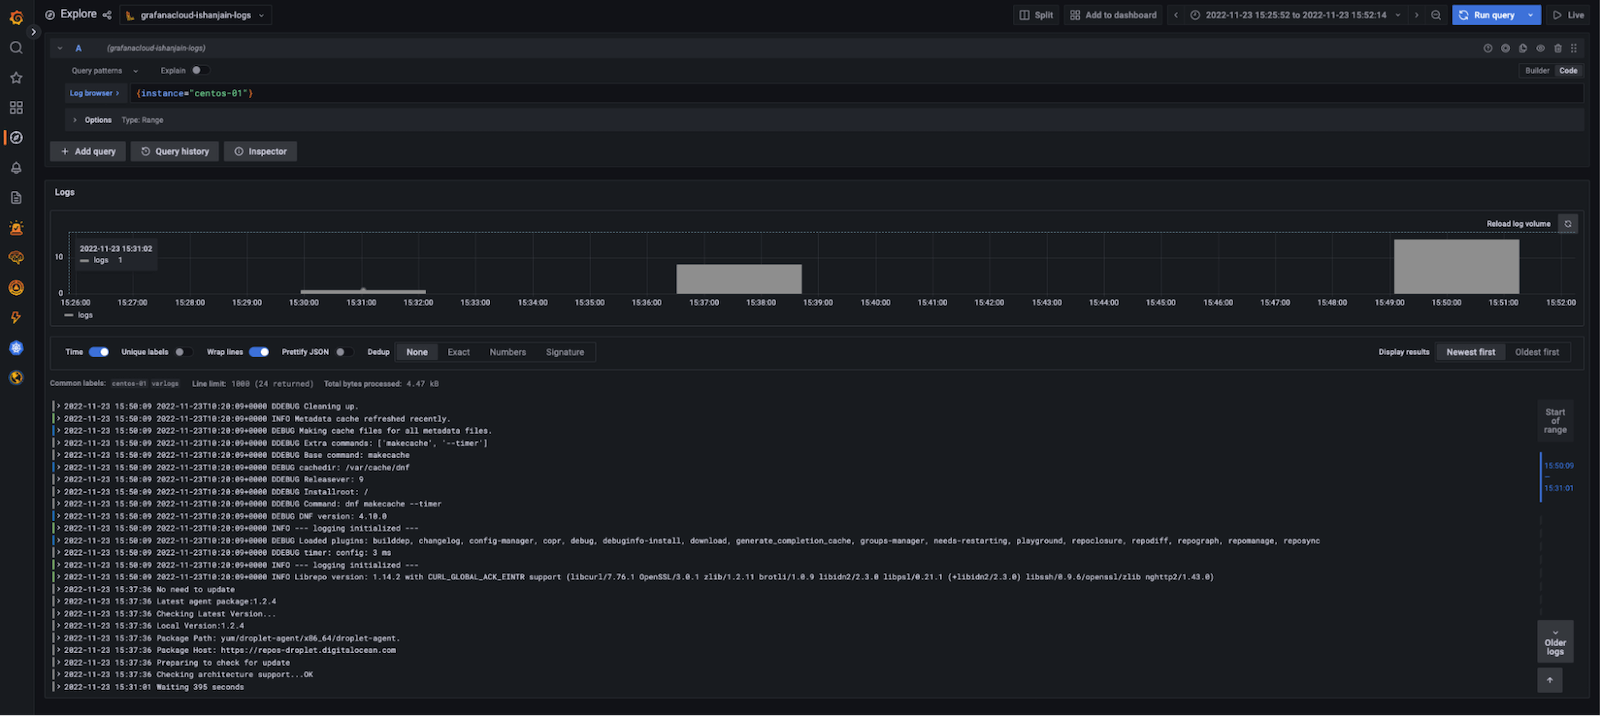
1. In the log browser, run the query `{instance="centos-01"}` where centos-01 is the hostname of one of the Linux hosts.
|
|
|
|
If you see log lines (shown in the example below), logs are being received.
|
|
|
|

|
|
|
|
If no log lines appear, logs are not being collected.
|
|
|
|
### Check metrics
|
|
|
|
To check metrics:
|
|
|
|
1. Use the dropdown menu at the top of the page to select your Prometheus data source.
|
|
|
|
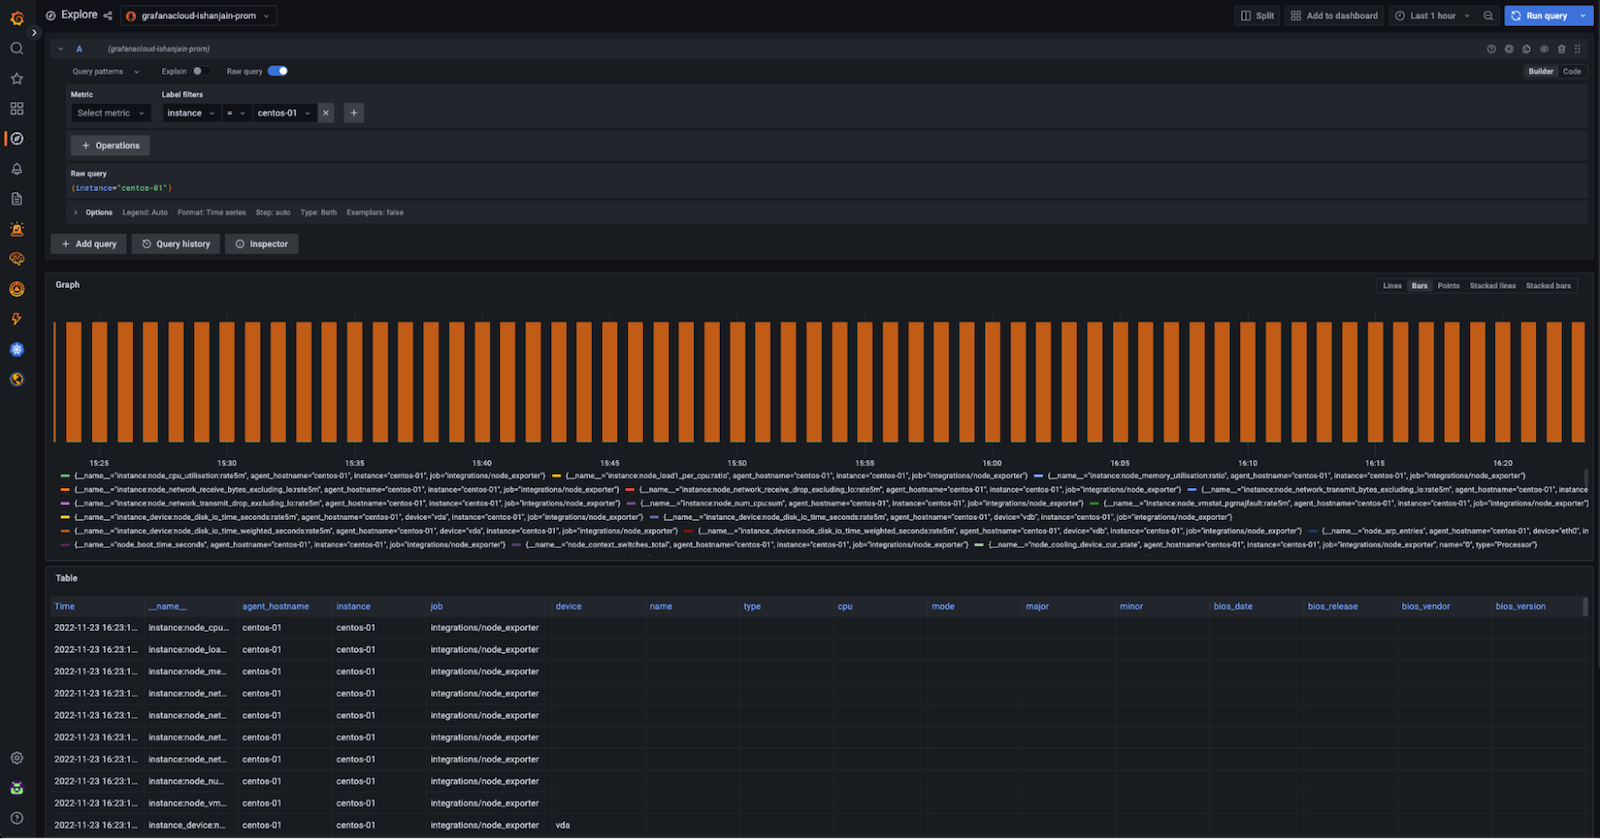
1. Run the query `{instance="centos-01"}` where centos-01 is the hostname of one of the Linux hosts.
|
|
|
|
If you see a metrics graph and table (shown in the example below), metrics are being received.
|
|
|
|

|
|
|
|
If no metrics appear, metrics are not being collected.
|
|
|
|
### View dashboards
|
|
|
|
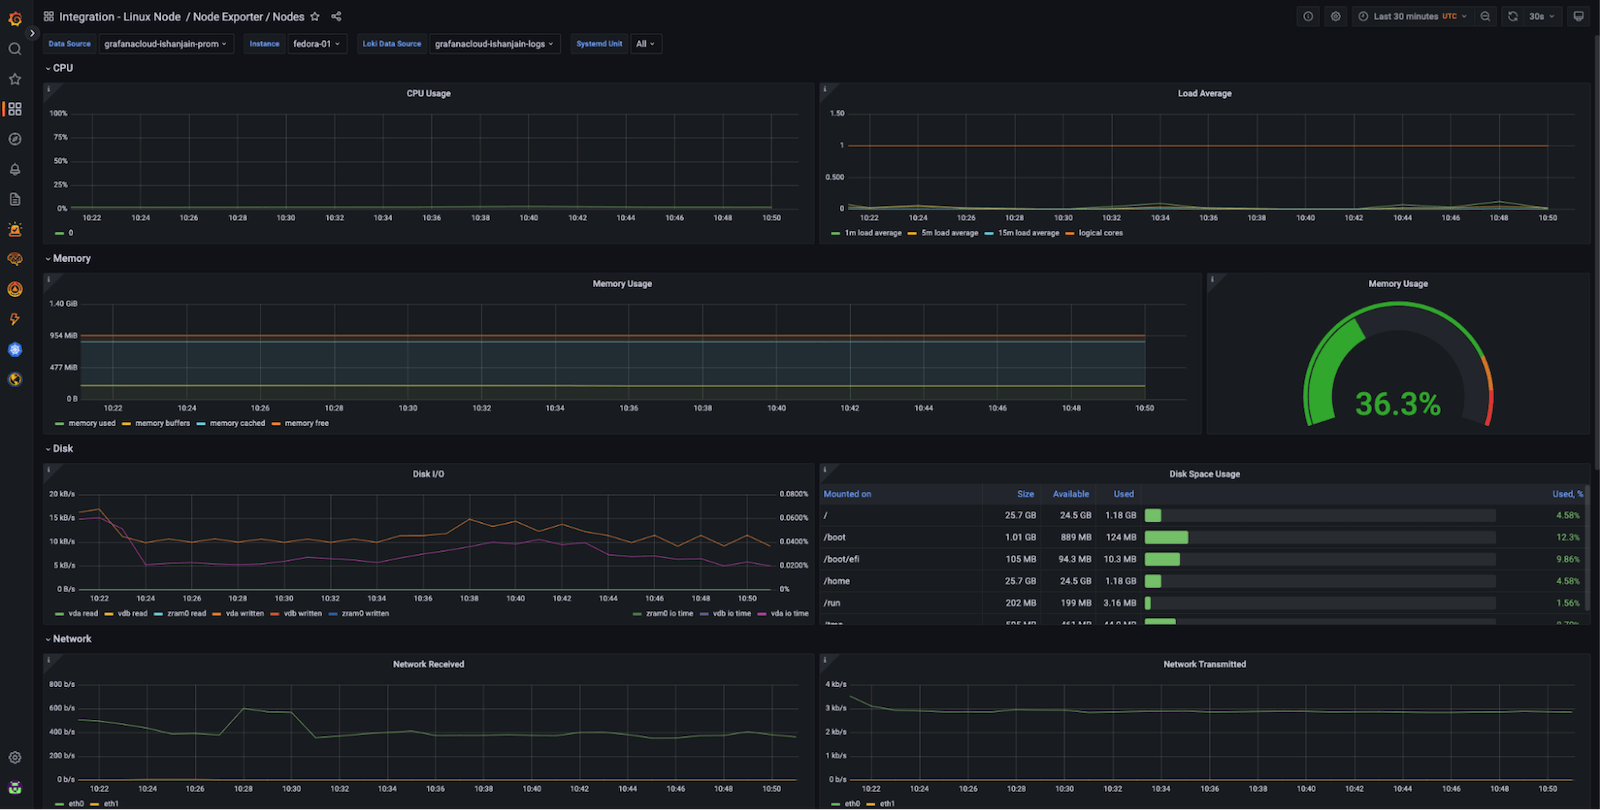
Now that you have logs and metrics in Grafana, you can use dashboards to view them.
|
|
Here's an example of one of the prebuilt dashboards included with the Linux integration in Grafana Cloud:
|
|
|
|

|
|
|
|
Using the **Instance** dropdown in the dashboard, you can select from the hostnames where you deployed Grafana Agent and start monitoring them.
|